
Multiple Comparisons Correction
Multiple Comparisons Correction
# First, import the necessary modules and functions
import os

import matplotlib.pyplot as plt
from myst_nb import glue
from nilearn import plotting
from repo2data.repo2data import Repo2Data

# Install the data if running locally, or points to cached data if running on neurolibre
DATA_REQ_FILE = os.path.abspath("../binder/data_requirement.json")
repo2data = Repo2Data(DATA_REQ_FILE)
data_path = repo2data.install()
data_path = os.path.join(data_path[0], "data")

# Set an output directory for any files generated during the book building process
out_dir = os.path.abspath("../outputs/")
os.makedirs(out_dir, exist_ok=True)
---- repo2data starting ----
/srv/conda/envs/notebook/lib/python3.7/site-packages/repo2data
Config from file :
/home/jovyan/binder/data_requirement.json
Destination:
./../data/nimare-paper

Info : ./../data/nimare-paper already downloaded
In NiMARE, multiple comparisons correction is separated from each CBMA and IBMA Estimator, so that any number of relevant correction methods can be applied after the Estimator has been fit to the Dataset.
Some correction options, such as the montecarlo option for FWE correction, are designed to work specifically with a given Estimator (and are indeed implemented within the Estimator class, and only called by the Corrector).
Correctors are divided into two subclasses: FWECorrectors, which correct based on family-wise error rate, and FDRCorrectors, which correct based on false discovery rate.
All Correctors are initialized with a number of parameters, including the correction method that will be used.
After that, you can use the transform method on a MetaResult object produced by a CBMA or IBMA Estimator to apply the correction method.
This will return an updated MetaResult object, with both the statistical maps from the original MetaResult, as well as new, corrected maps.
Here we will apply both FWE and FDR correction to results from a MKDADensity meta-analysis, performed back in Multilevel kernel density analysis.
Warning
In the following example, we use 5000 iterations for Monte Carlo FWE correction. Normally, one would use at least 10000 iterations, but we reduced this for the sake of speed.
from nimare import meta, correct

mkdad_meta = meta.cbma.mkda.MKDADensity.load(os.path.join(data_path, "MKDADensity.pkl.gz"))

mc_corrector = correct.FWECorrector(method="montecarlo", n_iters=5000, n_cores=4)
mc_results = mc_corrector.transform(mkdad_meta.results)
mc_results.save_maps(output_dir=out_dir, prefix="MKDADensity_FWE")

fdr_corrector = correct.FDRCorrector(method="indep")
fdr_results = fdr_corrector.transform(mkdad_meta.results)
INFO:nimare.correct:Using correction method implemented in Estimator: nimare.meta.cbma.mkda.MKDADensity.correct_fwe_montecarlo.
INFO:nimare.meta.cbma.base:Using null distribution for voxel-level FWE correction.
Statistical maps saved by NiMARE MetaResults automatically follow a naming convention based loosely on the Brain Imaging Data Standard (BIDS).
Let’s take a look at the files created by the FWECorrector.
from glob import glob

fwe_maps = sorted(glob(os.path.join(out_dir, "MKDADensity_FWE*.nii.gz")))
fwe_maps = [os.path.basename(fwe_map) for fwe_map in fwe_maps]
print("\n".join(fwe_maps))
MKDADensity_FWE_logp_desc-mass_level-cluster_corr-FWE_method-montecarlo.nii.gz
MKDADensity_FWE_logp_desc-size_level-cluster_corr-FWE_method-montecarlo.nii.gz
MKDADensity_FWE_logp_level-voxel_corr-FWE_method-montecarlo.nii.gz
MKDADensity_FWE_p.nii.gz
MKDADensity_FWE_stat.nii.gz
MKDADensity_FWE_z.nii.gz
MKDADensity_FWE_z_desc-mass_level-cluster_corr-FWE_method-montecarlo.nii.gz
MKDADensity_FWE_z_desc-size_level-cluster_corr-FWE_method-montecarlo.nii.gz
MKDADensity_FWE_z_level-voxel_corr-FWE_method-montecarlo.nii.gz
If you ignore the prefix, which was specified in the call to MetaResult.save_maps, the maps all have a common naming convention.
The maps from the original meta-analysis (before multiple comparisons correction) are simply named according to the values contained in the map (e.g., z, stat, p).
Maps generated by the correction method, however, use a series of key-value pairs to indicate how they were generated.
The corr key indicates whether FWE or FDR correction was applied.
The method key reflects the correction method employed, which was defined by the method parameter used to create the Corrector.
The level key simply indicates if the map was corrected at the voxel or cluster level.
Finally, the desc key reflects any necessary description that goes beyond what is already covered by the other entities.
meta_results = {
    "Cluster-level Monte Carlo": mc_results.get_map(
        "z_desc-size_level-cluster_corr-FWE_method-montecarlo",
        return_type="image",
    ),
    "Independent FDR": fdr_results.get_map(
        "z_corr-FDR_method-indep",
        return_type="image",
    ),
}

fig, axes = plt.subplots(figsize=(6, 4), nrows=2)

for i_meta, (name, file_) in enumerate(meta_results.items()):
    display = plotting.plot_stat_map(
        file_,
        annotate=False,
        axes=axes[i_meta],
        draw_cross=False,
        cmap="Reds",
        cut_coords=[0, 0, 0],
        figure=fig,
    )
    axes[i_meta].set_title(name)

    colorbar = display._cbar
    colorbar_ticks = colorbar.get_ticks()
    if colorbar_ticks[0] < 0:
        new_ticks = [colorbar_ticks[0], 0, colorbar_ticks[-1]]
    else:
        new_ticks = [colorbar_ticks[0], colorbar_ticks[-1]]
    colorbar.set_ticks(new_ticks, update_ticks=True)

glue("figure_corr_cbma", fig, display=False)
/srv/conda/envs/notebook/lib/python3.7/site-packages/nilearn/plotting/img_plotting.py:348: FutureWarning: Default resolution of the MNI template will change from 2mm to 1mm in version 0.10.0
  anat_img = load_mni152_template()

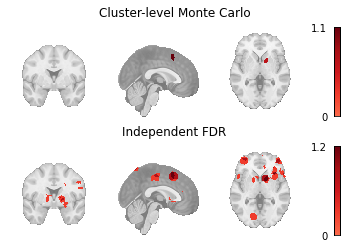
Fig. 7 An array of plots of the corrected statistical maps produced by the different multiple comparisons correction methods.