
Meta-Analytic Subtraction Analysis
Meta-Analytic Subtraction Analysis
# First, import the necessary modules and functions
import os

import matplotlib.pyplot as plt
from myst_nb import glue
from nilearn import image, plotting
from repo2data.repo2data import Repo2Data

from nimare import dataset

# Install the data if running locally, or points to cached data if running on neurolibre
DATA_REQ_FILE = os.path.abspath("../binder/data_requirement.json")
repo2data = Repo2Data(DATA_REQ_FILE)
data_path = repo2data.install()
data_path = os.path.join(data_path[0], "data")

# Now, load the Datasets we will use in this chapter
sleuth_dset1 = dataset.Dataset.load(os.path.join(data_path, "sleuth_dset1.pkl.gz"))
sleuth_dset2 = dataset.Dataset.load(os.path.join(data_path, "sleuth_dset2.pkl.gz"))
---- repo2data starting ----
/srv/conda/envs/notebook/lib/python3.7/site-packages/repo2data
Config from file :
/home/jovyan/binder/data_requirement.json
Destination:
./../data/nimare-paper

Info : ./../data/nimare-paper already downloaded
Subtraction analysis refers to the voxel-wise comparison of two meta-analytic samples. In image-based meta-analysis, comparisons between groups of maps can generally be accomplished within the standard meta-regression framework (i.e., by adding a covariate that codes for group membership). However, coordinate-based subtraction analysis requires special extensions for CBMA algorithms.
Subtraction analysis to compare the results of two ALE meta-analyses was originally implemented by Laird et al. [2005] and later extended by Eickhoff et al. [2012]. In this approach, two groups of experiments (A and B) are compared using a group assignment randomization procedure in which voxel-wise null distributions are generated by randomly reassigning experiments between the two groups and calculating ALE-difference scores for each permutation. Real ALE-difference scores (i.e., the ALE values for one group minus the ALE values for the other) are compared against these null distributions to determine voxel-wise significance. In the original implementation of the algorithm, this procedure is performed separately for a group A > B contrast and a group B > A contrast, where each contrast is limited to voxels that were significant in the first group’s original meta-analysis.
Important
In NiMARE, we use an adapted version of the subtraction analysis method in ALESubtraction.
The NiMARE implementation analyzes all voxels, rather than only those that show a significant effect of A alone or B alone as in the original implementation.
Important
Running a subtraction analysis with the standard number of iterations (10000) may require more than 4 GB of RAM, which is NeuroLibre’s limit. We will instead use only 1000 iterations, so that the analysis will run successfully on NeuroLibre’s server. For publication-quality subtraction analyses, we recommend using the standard 10000 iterations.
from nimare import meta

kern = meta.kernel.ALEKernel()
sub_meta = meta.cbma.ale.ALESubtraction(kernel_transformer=kern, n_iters=1000)
sub_results = sub_meta.fit(sleuth_dset1, sleuth_dset2)
fig, ax = plt.subplots(figsize=(6, 2))
display = plotting.plot_stat_map(
    sub_results.get_map("z_desc-group1MinusGroup2", return_type="image"),
    annotate=False,
    axes=ax,
    cmap="RdBu_r",
    cut_coords=[0, 0, 0],
    draw_cross=False,
    figure=fig,
)
ax.set_title("ALE Subtraction")

colorbar = display._cbar
colorbar_ticks = colorbar.get_ticks()
if colorbar_ticks[0] < 0:
    new_ticks = [colorbar_ticks[0], 0, colorbar_ticks[-1]]
else:
    new_ticks = [colorbar_ticks[0], colorbar_ticks[-1]]
colorbar.set_ticks(new_ticks, update_ticks=True)
glue("figure_subtraction", fig, display=False)
/srv/conda/envs/notebook/lib/python3.7/site-packages/nilearn/plotting/img_plotting.py:348: FutureWarning: Default resolution of the MNI template will change from 2mm to 1mm in version 0.10.0
  anat_img = load_mni152_template()
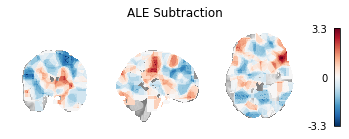

Fig. 8 Unthresholded z-statistic map for the subtraction analysis of the two example Sleuth-based Datasets.
Alternatively, MKDA Chi-squared analysis is inherently a subtraction analysis method, in that it compares foci from two groups of studies. Generally, one of these groups is a sample of interest, while the other is a meta-analytic database (minus the studies in the sample). With this setup, meta-analysts can infer whether there is greater convergence of foci in a voxel as compared to the baseline across the field (as estimated with the meta-analytic database), much like SCALE. However, if the database is replaced with a second sample of interest, the analysis ends up comparing convergence between the two groups.